
The Crocus EdPrep Dashboards
“This is a game changer for our program!
We can use strong data and move away from anecdotal information. We can assess the quality of our graduates and the rigor of our work. There will be no more excuses; we’ll have the data necessary to accurately inform program improvement and ensure program quality to show reality and focus on program improvement.”
– Patricia Alvarez McHatton, PhD
UTRGV Executive Vice President for Academic Affairs, Student Success, and P-16 Integration
Each module listed below is comprised of individual dashboards designed to illustrate key insights.
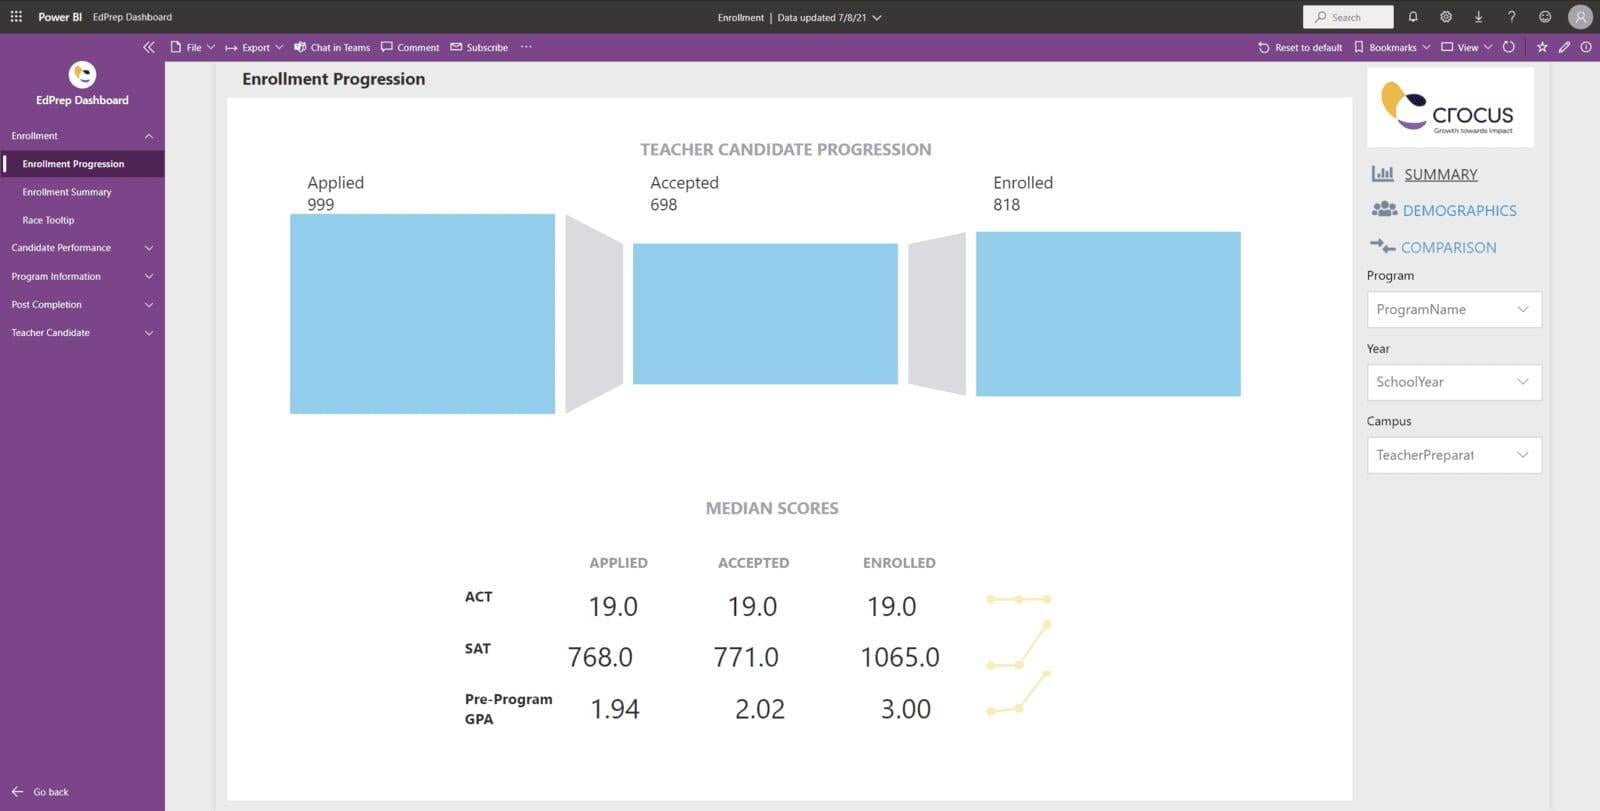
Enrollment
The Enrollment module addresses the pipeline and progression into the program and profile of teacher candidates in the program. This includes the number of applied, accepted, and enrolled teacher candidates and the median pre-program ACT score, SAT scores, and pre-program GPA for each of these groups.
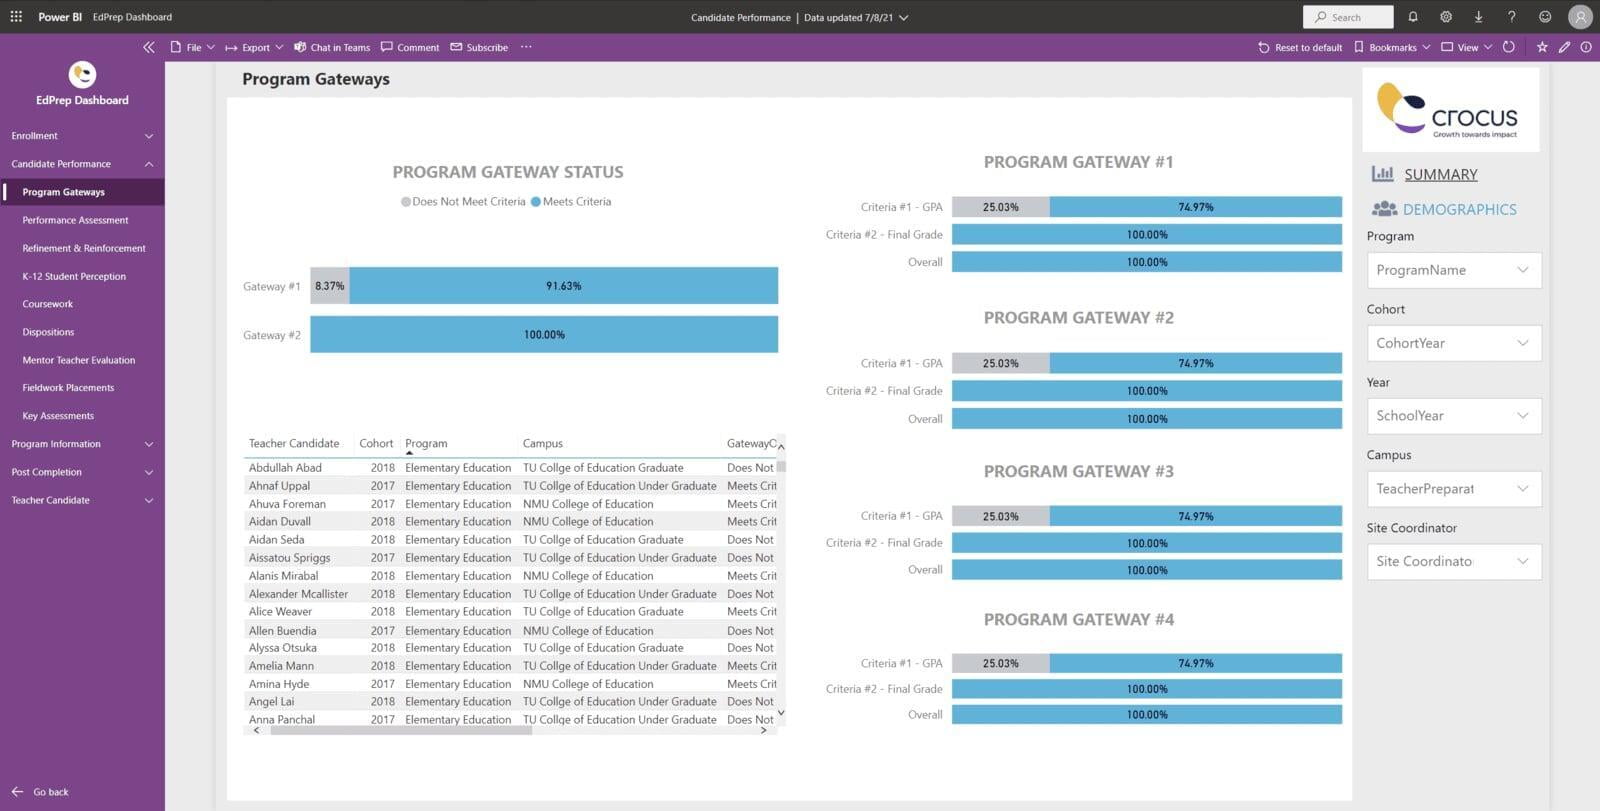
Candidate Performance
Candidate Performance tracks teacher candidates progress through the program including their coursework, clinical experience, performance assessments, disposition assessments, mentor evaluations, K-12 student perception surveys, and key program assessments. The landing page of Candidate Performance contains a concept of transition points, which can be customized to meet the needs of a program's defined gateways.
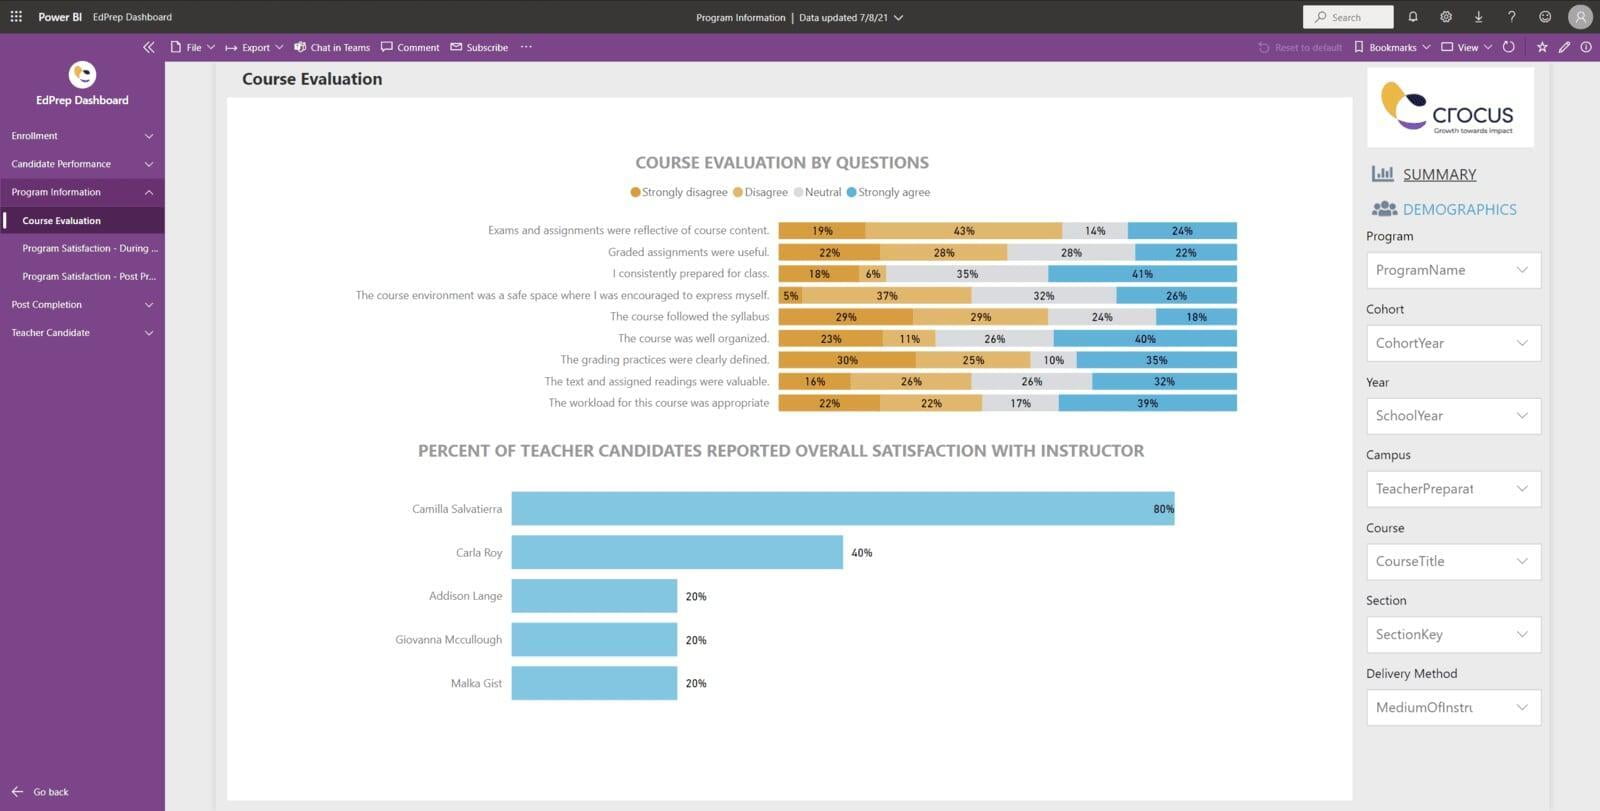
Program Information
Program Information includes information about the program gathered through surveys, including course evaluations, during program and post program surveys from program completers and employers.
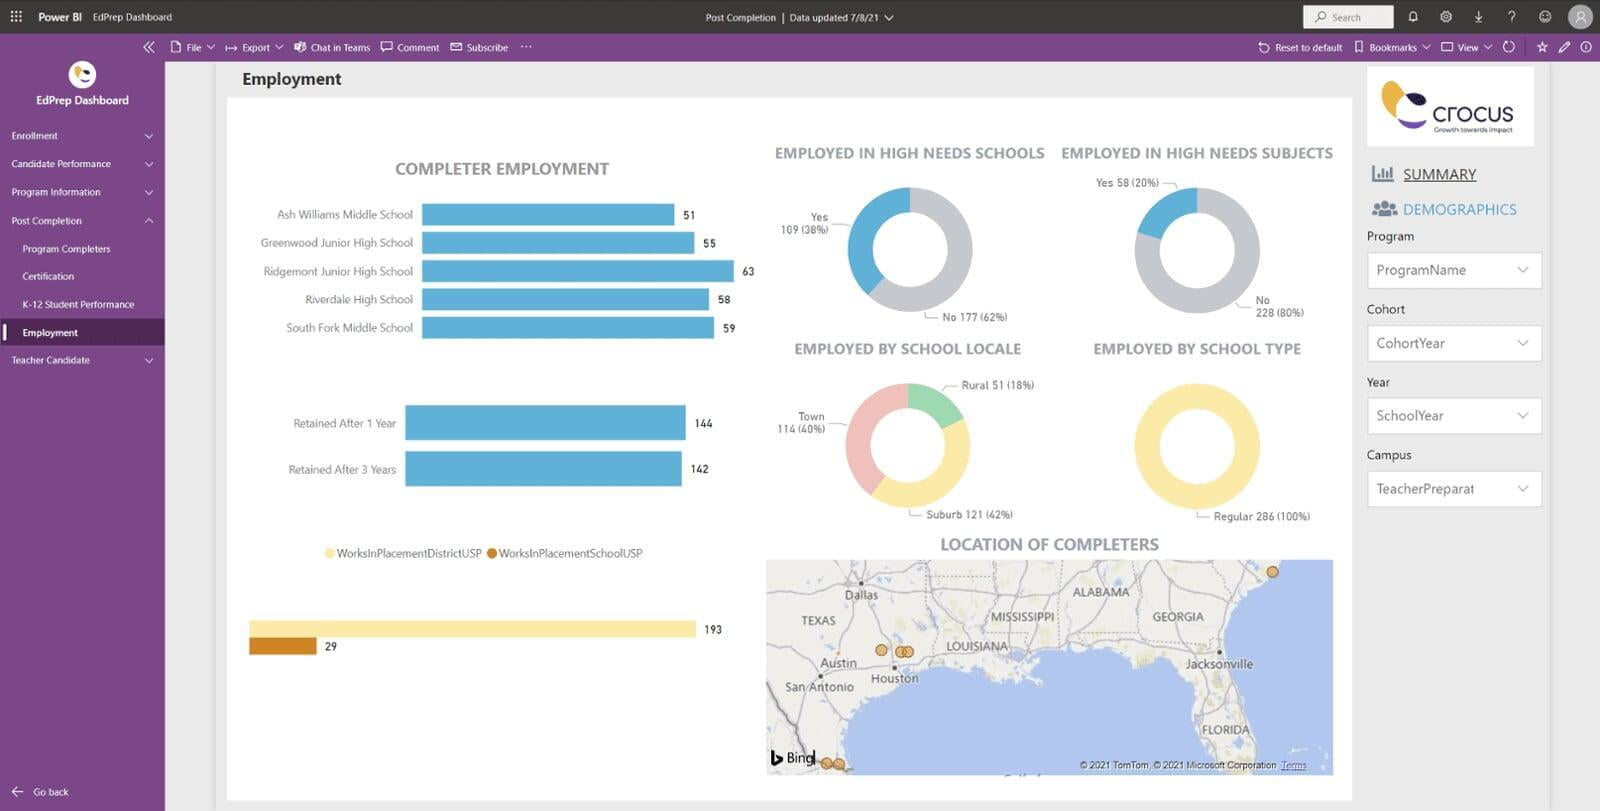
Post Completion
Post Completion includes data for program completers and those that are now employed as educators. Visualizations include a summary of completers by program, certification area, and time taken to complete the program. This module also includes certification details for completers, employment information, and K-12 student performance of employed completers.
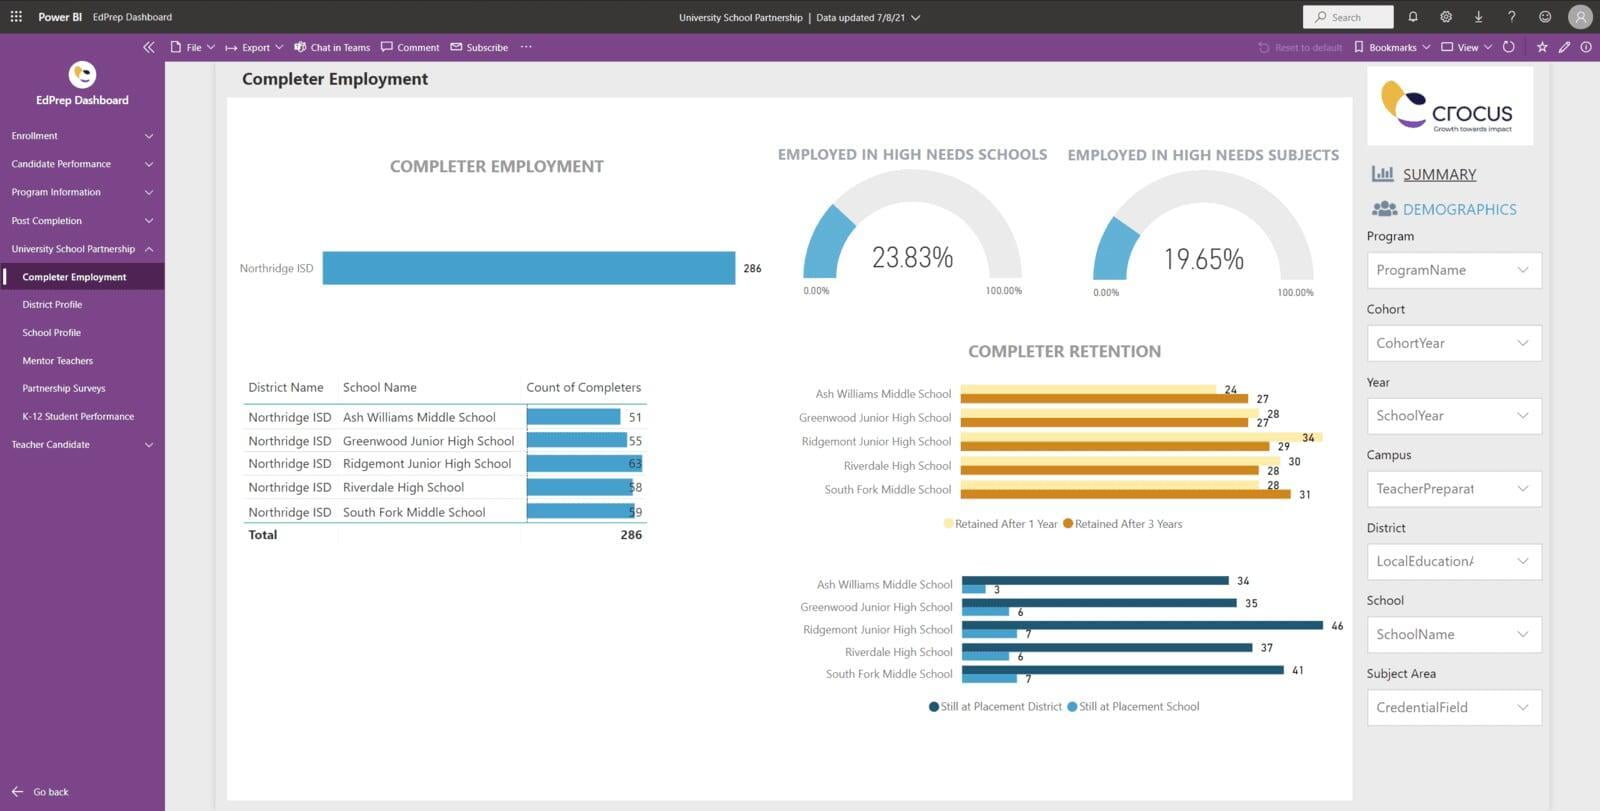
University School Partnerships
University School Partnerships includes similar visualizations as Post-Completion, with the purpose of examining information for EPP district and school partners. This includes completer employment, district profiles, K-12 student information, mentor teacher information, partnership surveys such as principal surveys, and K-12 student performance.
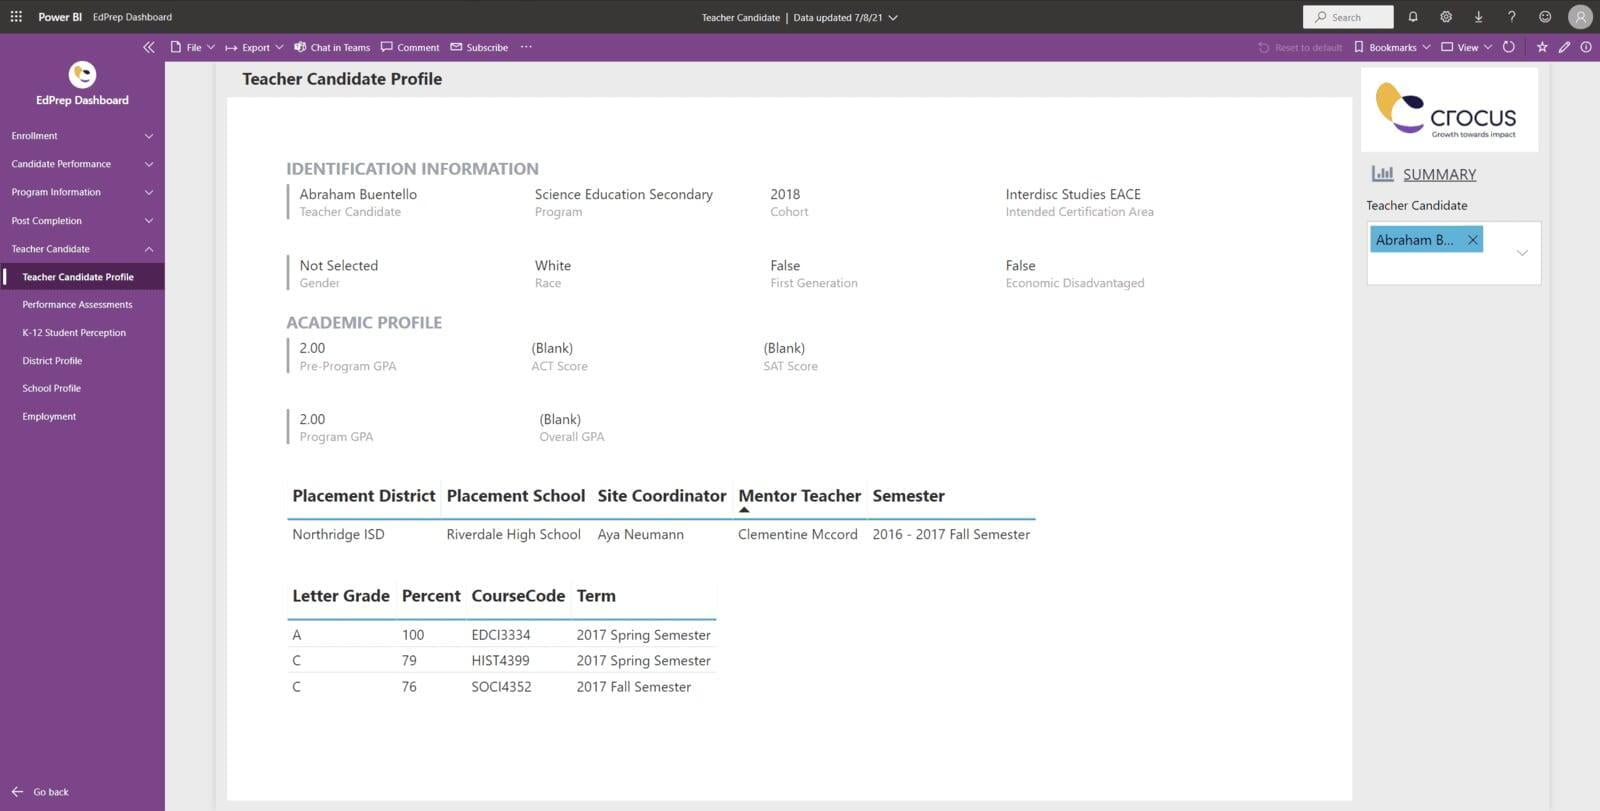
Teacher Candidate
The Teacher Candidate module includes data on an individual candidate. This can be used by faculty and staff when advising candidates, or made available to candidates to review their own progress. Data includes identification information, academic profile, placement information, performance scores, and K-12 perception surveys. This module also contains the same district and school information found in University-School Partnerships. This enables EPPs to provide this data to candidates to support their decisions for field work placements.
How can I implement the complete EdPrep Dashboard?
The EdPrep Challenge will provide an easy entry-level solution for an organization to determine the value and feasibility of a complete Ed-Fi data model and dashboard implementation.
The full EdPrep Dashboard implementation includes four additional modules and additional pages of Candidate Performance including: Program Information, Post Completion, University School Partnerships, and Teacher Candidate. Implementing the complete EdPrep Dashboard requires additional data from your organization.
If you are interested in an EdPrep Dashboard implementation please contact Crocus at hello@crocusllc.com.
Crocus EdPrep Challenge
Selected EPPs will receive a free subscription for a year to use EdLaunch™ the EdPrep data platform